Most website reports are very good at producing numbers and surprisingly poor at explaining what those numbers mean.
A business owner does not need twenty pages of charts simply proving that Google Analytics exists. They need clear answers to a much shorter list of questions:
- Is the website being found by more of the right people?
- Which pages and search channels are contributing?
- Are visitors taking useful actions?
- What deserves attention next month?
That is the thinking behind the reporting dashboard I have been building into the NI Designer Toolbox.
It brings website performance, contact tracking and local search visibility into one place. More importantly, it is designed to turn that evidence into a short interpretation and a practical list of priorities.
A report should start with what changed
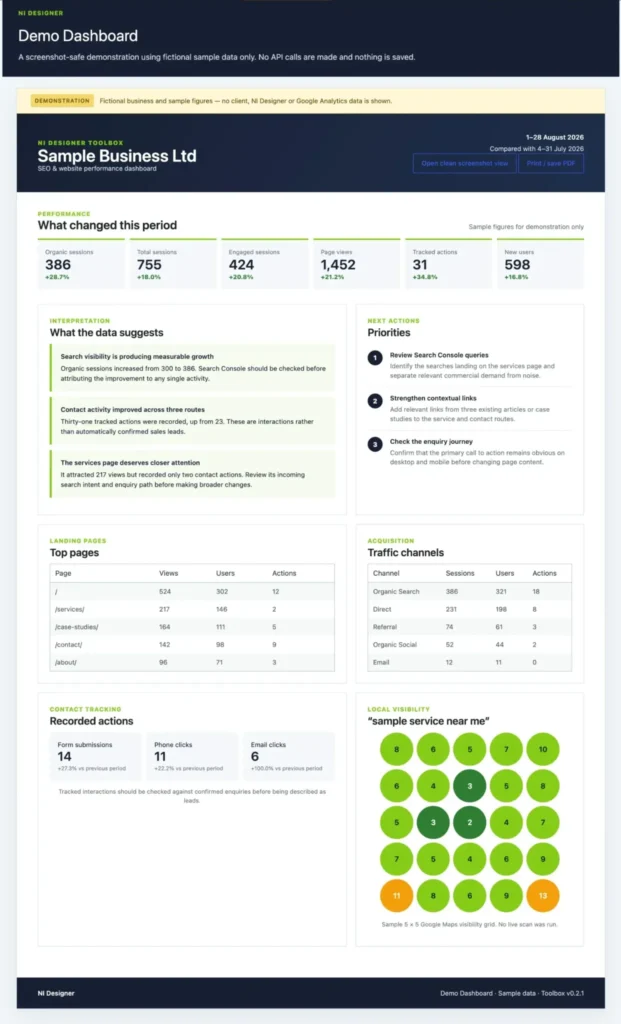
The first section compares the current reporting period with the previous equivalent period. It covers the figures that provide the broadest view of website activity, including:
- organic sessions;
- total sessions;
- engaged sessions;
- page views;
- new users; and
- tracked actions.
The comparison matters. A figure such as 386 organic sessions means very little on its own. Knowing that it increased from 300 gives it context and tells us that something is worth investigating.
That still does not prove why the increase happened. Search demand may have changed. A page may have moved in the results. A campaign, referral or seasonal pattern may have contributed. A responsible report should identify the movement first and then use the available evidence to investigate it.
Interpretation is more valuable than decoration
This is where many automated reports become unhelpful. They display a red or green percentage but leave the client to decide whether it matters.
The Toolbox adds an interpretation layer. It looks at the relationship between traffic sources, page performance and recorded actions, then highlights the changes that appear most significant.
These are evidence-led interpretations, not invented explanations. If organic traffic rises, the report can say that search visibility or demand deserves closer examination. It should not claim that a particular piece of SEO work caused the increase unless Search Console, ranking data and other evidence support that conclusion.
The wording is deliberately careful because confidence in a report is more important than making every result sound impressive.
Every observation needs a next action
A monthly SEO report should not be the end of a piece of work. It should help determine what happens next.
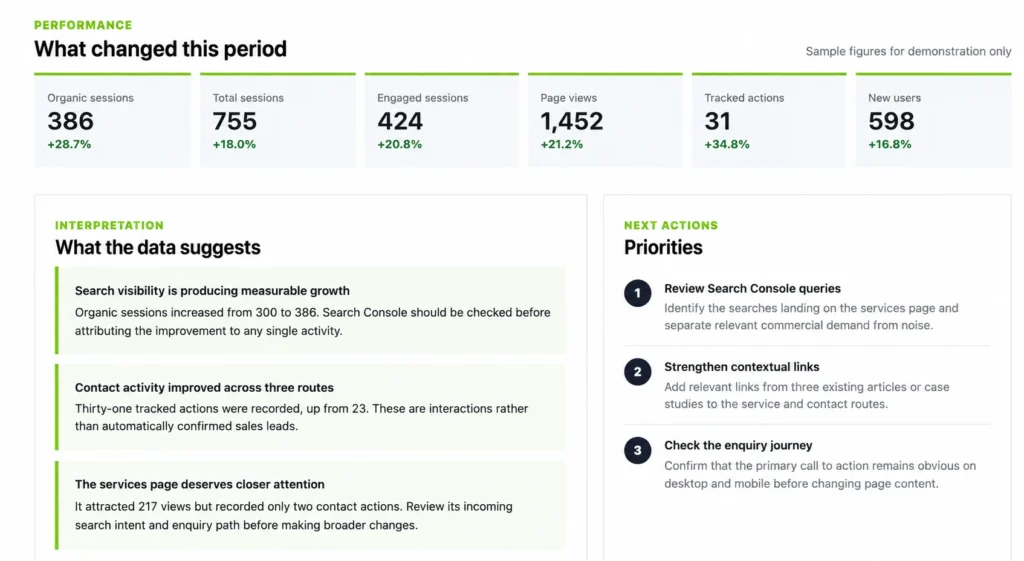
If a service page attracts more visitors but few recorded contact actions, possible next steps might include:
- checking the Search Console queries bringing visitors to that page;
- confirming that those searches match the service being offered;
- reviewing the page’s internal links and enquiry route; and
- checking the page on a real mobile device before changing its content.
That is more useful than simply labelling the page’s performance as “good” or “bad”. It creates a testable piece of work for the next period.
The aim is not to generate a fresh list of generic SEO jobs every month. It is to use the evidence to decide which small number of actions are most likely to matter.
Contact actions are not automatically leads
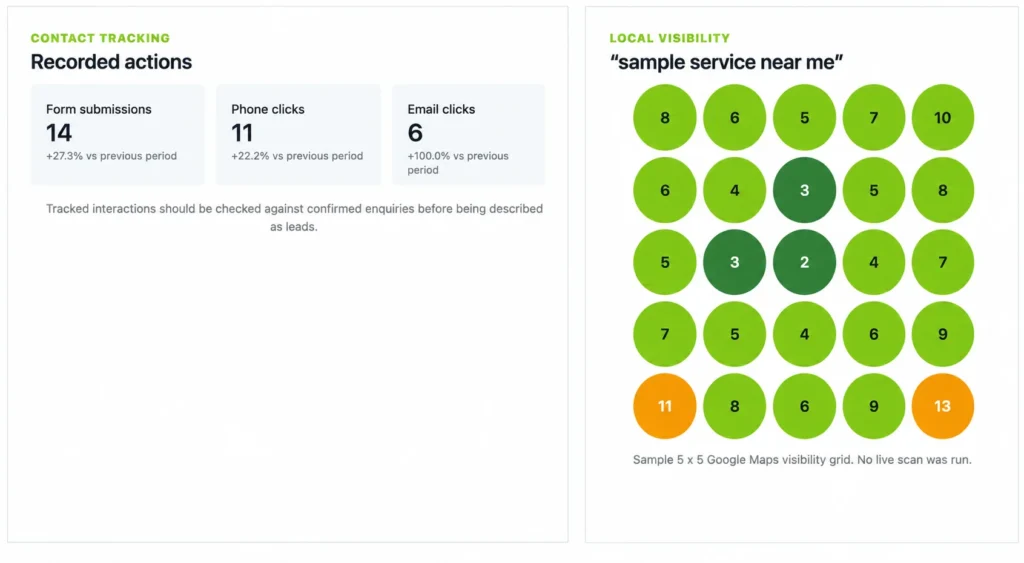
Traffic is only part of website performance. The Toolbox can also report recorded actions such as:
- submitted enquiry forms;
- telephone link clicks; and
- email link clicks.
Tracking all three gives a more complete picture than relying on one form alone. Some visitors will call directly or open an email rather than submit the main enquiry form.
However, an email or telephone click is still an interaction—not automatically a confirmed sales lead. Form submissions can usually be checked against the enquiries received, while clicks need to be interpreted more cautiously.
The dashboard keeps that distinction visible. It helps show whether the website is encouraging contact without inflating the number of genuine enquiries.
Local visibility needs a local view
For businesses serving a defined area, an average map ranking can hide a great deal.
A business may appear prominently close to its address but become far less visible only a few miles away. A local visibility grid samples searches from multiple points across the target area so that this pattern can be seen.
That creates better questions. Is the business visible where its customers actually live? Are there weak areas around an important town? Has visibility improved consistently, or only close to the business address?
The answer may influence Google Business Profile work, service-area content, local links and future page priorities.
Built for clearer client conversations
The current Toolbox brings the reporting process into the NI Designer website administration area. It can create a branded report that can be reviewed, printed or saved as a PDF.
The next stage is a secure client login area where each SEO client can access their own reports without seeing another business’s information. That portal is not being presented as complete today; it is the next part of the build.
Building the reporting system first means the client area will have something genuinely useful to display when it is introduced.
What this changes about monthly SEO work
The purpose of this system is not to make SEO look more complicated. It is to make the work more accountable.
Each monthly report should leave the client with:
- a clear view of what changed;
- an honest explanation of what the evidence suggests;
- a record of meaningful website interactions;
- local visibility where it is relevant; and
- a focused list of actions for the next period.
That is the standard I want the NI Designer Toolbox to meet. The systems behind the website now need to help produce better decisions, clearer communication and steady, measurable work—not just another dashboard full of numbers.
If you run a small business in Northern Ireland and want a clearer understanding of how your website is performing, get in touch with NI Designer.